Build Your Marketing Plan in 12 Slides: A Practical Guide for Marketers and SMEs
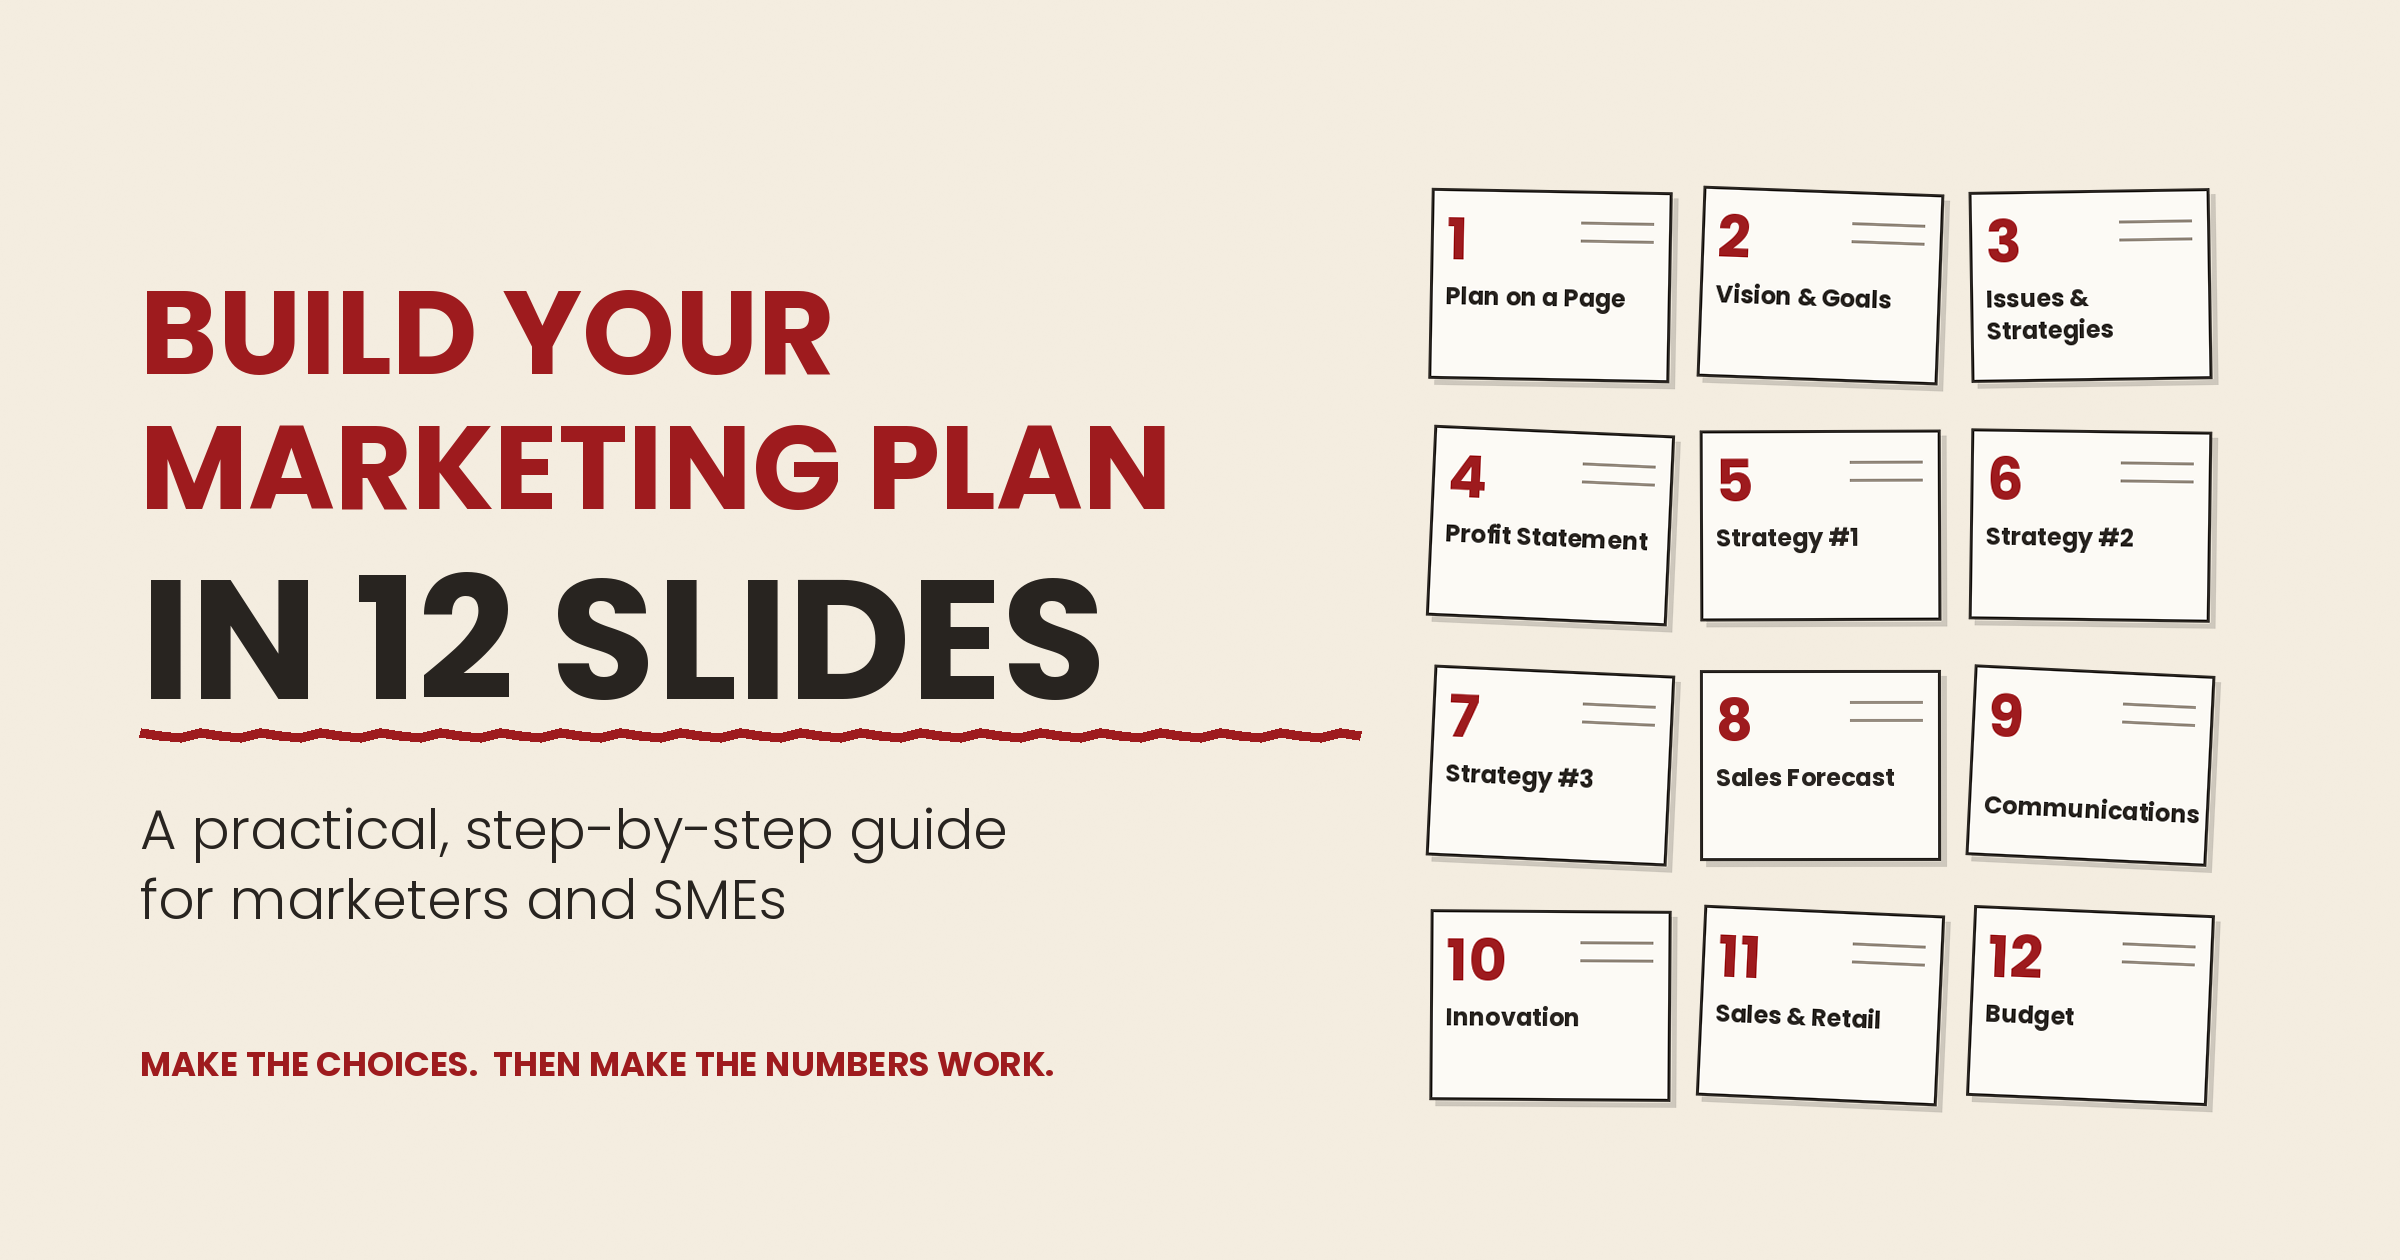
A good marketing plan fits on 12 slides: make the strategic choices first, then make the numbers work. Most plans fail not because they are too short, but because they are long lists of activities with no clear choices behind them.
The 12 slides fall into five jobs:
- Make the choices (slides 1–3: plan on a page, vision & goals, issues & strategies). Answer: where are we going, and what is in the way?
- Prove it pays (slides 4 and 8: profit statement, sales forecast). Answer: is this worth doing financially?
- Turn strategy into action (slides 5–7: strategies #1–#3). Answer: what exactly will we do, and what will we avoid?
- Plan execution (slides 9–11: communications, innovation, sales & retail). Answer: how will each function deliver?
- Fund it (slide 12: marketing budget). Answer: where does the money go?
Part 1: Make the choices (slides 1–3)
Slide 1 — Plan on a page. This is the whole plan in one view. Analysis and strategy feed a value proposition. That proposition is aimed at a target audience through chosen channels, and tied to goals and measurement. If you cannot fill this slide, you are not ready to write the other 11.
Slide 2 — Vision & goals. The vision is one ambitious sentence: "be the first healthy cookie to reach $100M." Goals turn it into numbers by year: sales, distribution points, market share and repeat rate. Each goal gets a short comment explaining how it will be reached, such as "expand to new channels".
Slide 3 — Issues & strategies. Name the three biggest problems standing between you and the vision. The cookie brand lists a health-versus-indulgence perception gap, a crowded aisle and distribution gaps. Each issue then maps to exactly one strategy: lead with the health story, own the better-for-you space, build broader distribution.
The lesson: strategies are answers to specific problems. If a strategy does not solve a named issue, cut it.
Part 2: Prove it pays (slides 4 and 8)
Marketers lose credibility in the boardroom when they talk only about awareness. Slides 4 and 8 put the plan in the language of finance.
Slide 4 — Profit statement. A three-year P&L snapshot shows the plan grows profit, not just sales:
- Net sales: $37.3M in 2023, $75M in 2024, $100M in 2025.
- Gross profit margin: 43%, rising to 45% and holding at 45%.
- Operating profit margin: 12%, then 14%, then 16%.
- Net profit margin: 8%, then 10%, then 12%.
Three comments sit beside it: strong growth with healthy margins, invest in the brand to drive scale, and focus on profitable channels.
Slide 8 — Sales forecast. The trajectory runs $37.3M (base year) to $75M (distribution lift) to $100M (scale and share gains). The key habit here is the comments column: every number needs a driver. A forecast without reasons is a wish.
Part 3: Turn strategy into action (slides 5–7)
Each strategy gets its own slide with the same three parts: a strategic objective, three tactics, and a "watch out". The watch-out is the most underrated idea in the framework. It names the mistake your team is most likely to make while executing.
- Strategy #1 (slide 5): increase penetration in health-conscious households.
- Tactics: health-focused media, wellness influencers, sampling at key retailers.
- Watch out: diluting the health message.
- Strategy #2 (slide 6): expand distribution to grow availability and share.
- Tactics: open national chains, strengthen regional coverage, improve in-store placement.
- Watch out: chasing low-value accounts.
- Strategy #3 (slide 7): build loyalty and repeat purchase.
- Tactics: loyalty rewards, CRM and email nurture, subscriptions and bundles.
- Watch out: over-discounting the brand.
Notice the pattern: penetration, then availability, then loyalty. The three strategies cover getting new buyers, making it easy to buy, and getting buyers to come back. Most brands need all three, in a ratio set by their biggest issue.
Part 4: Execution plans (slides 9–11)
Strategy slides say what to do. Execution slides tell each function how. Each one has an objective, tactics, and a way to measure success.
Slide 9 — Communications plan. Objective: build awareness and trust with health-minded consumers. Tactics span content and PR, social, influencers, and email and SMS. Measurement runs down the funnel: awareness, engagement, traffic, conversion.
Slide 10 — Innovation plan. Objective: keep the brand fresh and lead the category. Focus areas are new flavours and formats, clean-label improvements and functional benefits. A simple pipeline (idea, develop, launch) keeps new products moving instead of stalling as ideas.
Slide 11 — Sales & retail plan. Objective: win at retail and drive velocity on the shelf. Tactics include category captain partnerships, planograms and displays, retailer promotions and field sales. Measurement uses retail metrics: distribution, velocity and ACV (all-commodity volume, the share of stores weighted by sales that carry you).
The point of separate slides is ownership. The comms lead, the product lead and the sales lead can each see exactly what they are accountable for.
Part 5: Fund it (slide 12)
The budget slide shows where every dollar goes and why. The example splits $13.5M across seven areas. Below, the shares are recalculated from the dollar amounts:
- Advertising: $4.5M (33%) for brand awareness.
- Digital: $3.0M (22%) for performance and social.
- Trade: $2.5M (19%) for retail promotions.
- PR & influencer: $1.5M (11%) for earned media.
- Content: $1.0M (7%) for blog, video and more.
- Events: $0.5M (4%) for sampling and demos.
- Other: $0.5M (4%) for research and tools.
Total: $13.5M (100%).
A sanity check worth copying
The framework's closing line is "make the choices, then make the numbers work." Running that check on the illustrative example shows why it matters:
- Percentages must add up. The infographic prints shares of 30%, 20%, 16%, 10%, 7%, 3% and 3%. Those total 89%, not 100%.
- Budget must fit the P&L. A $13.5M budget against $37.3M in 2023 sales is 36% of revenue. That cannot coexist with a 12% operating margin on a 43% gross margin.
- Timelines must agree. The vision says $100M by 2030, but the forecast reaches $100M in 2025.
- Growth needs a driver. Sales doubling in one year (+101%) needs a very specific explanation, not just "distribution lift".
The example is illustrative, so these gaps are forgivable. In your own plan, they are exactly what a finance director will spot first.
Actionable steps: build your plan in 10 moves
Work in this order. It is not the slide order, because the numbers should test the strategy before you polish anything.
- Write your vision in one sentence (slide 2). Include a number and a date, such as "become the No. 1 local skincare brand, reaching GHS 5M in sales by 2028". If it has no number, it is a slogan.
- Set three to five goals with a year and a target each (slide 2). Mix a sales goal with a leading indicator you control: outlets stocking you, repeat rate, customer count.
- List every problem, then pick the top three (slide 3). Use customer interviews, sales data and competitor visits. Choose the issues that block the vision most, not the easiest ones to fix.
- Write one strategy per issue (slides 3, 5–7). Phrase each as a verb plus an outcome: "grow repeat purchase among first-time buyers".
- Pick three tactics per strategy, and one watch-out. Ask: "How could we execute this badly?" That answer is your watch-out.
- Build the sales forecast bottom-up (slide 8). Sales = customers × purchase frequency × average order value. Write the driver beside every year's number.
- Draft the P&L and test it (slide 4). Check that marketing spend, cost of goods and overheads still leave a profit. If not, cut tactics, not margins.
- Assign each execution slide to an owner (slides 9–11). Give every slide one objective and one or two measures that the owner reports monthly.
- Allocate the budget last (slide 12). Fund the top strategy first. Make sure percentages add to 100% and spend fits your P&L.
- Fill in the plan on a page (slide 1) and stress-test it. Hand it to someone outside marketing. If they can explain your plan back to you in two minutes, it works.
Review it quarterly
- Compare actual sales against each forecast driver
- Check each strategy's measures against its goal
- Ask whether any watch-out has happened
- Move budget from what is not working to what is
Making it work for SMEs
You do not need a $13.5M budget or a national retail chain to use this framework. Scale each slide to your business:
- Profit statement. Swap the three-year audited P&L for a simple monthly spreadsheet of revenue, costs and profit.
- Strategies. Instead of three national strategies, choose one or two focused on your biggest bottleneck.
- Communications. Replace paid media and agencies with WhatsApp Business, Instagram, Google Business Profile and referrals.
- Innovation. Instead of an R&D pipeline, launch one new product, bundle or service per quarter and test it with existing customers.
- Sales & retail. Instead of category captaincy and ACV, build strong relationships with five to ten key stockists and secure good shelf placement.
- Budget. Replace a seven-line allocation with a fixed share of revenue split across two or three channels you can measure.
Three SME rules of thumb:
- Fewer strategies, more focus. With limited cash, one strategy done well beats three done halfway.
- Measure what you can see. Track sales by channel, repeat customers and cost per new customer. Skip metrics you cannot collect.
- Keep it alive. A 12-slide plan is short enough to revisit every quarter. Use that advantage.
A marketing plan is a set of choices backed by numbers.